Indicator-Sysmonitor (System Monitor Indicator) is a really interesting Ubuntu indicator because it allows you to display pretty much anything on the Unity (or GNOME) panel by using a simple command or a bash script.
(Speaking of Indicator-Sysmonitor: a recent update brought sensors support (make sure you install hddtemp and lm-sensors), but this post isn't about that)
Currently there is no AppIndicator to display the actual network usage as in the actual values on the Unity panel in Ubuntu 11.04. We have Indicator Multiload but it only displays a graph so I wrote a script for Indicator-Sysmonitor to display the network upload/download speed as well as CPU and Memory usage (Indicator Sysmonitor already has CPU and Memory usage but if you want to use a script, you must get your script to display the CPU and Memory usage independently).
Getting Indicator-Sysmonitor to display network upload / download speed
Before getting started, please note that while this worked just fine on my computer,
1. Firstly, install Indicator-Sysmonitor. For Ubuntu 11.04:
sudo add-apt-repository ppa:alexeftimie/ppa
sudo apt-get update
sudo apt-get install indicator-sysmonitor
If you use Ubuntu 10.10 (not working in Ubuntu 10.04!), download .deb from here.
2. Install dstat (this is required by my script):
sudo apt-get install dstat3. Now you must download the script. Let's create a folder (if it doesn't exists already) called "scripts" in your home directory and download the script there:
mkdir -p ~/scripts && cd ~/scripts
wget http://webupd8.googlecode.com/files/sysmon_0.2.tar.gz && tar -xvf sysmon_0.2.tar.gz
4. Setting Up System Monitor Indicator to use the script.
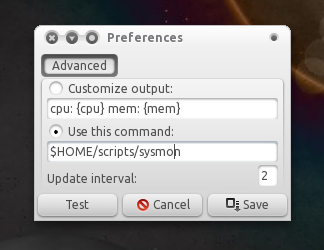
Now open Indicator-Sysmonitor (it should show up as System Monitor Indicator in the menu), then click it on the panel and select "Preferences" and under "Use this command", enter this:
$HOME/scripts/sysmonThen save. For me, each time I save the Indicator-Sysmon preferences, the applet freezes. If that's the case for you too, run this in a terminal:
killall indicator-sysmonitorThen start it again.
4. Configuring the script
By default, the script displays the RAM and network usage. You can also display the CPU usage or any other combination (display the network usage only, display all: the CPU, ram and network, etc.). For this, open the script (run the following command in a terminal):
gedit ~/scripts/sysmonAnd on top of the file you'll see something like this:
#settings:
netspeed=true
ram=true
cpu=false
What these do is pretty much obvious - change the items you want to be displayed on the panel to true and the rest to false. Feel free to tweak the script to display other stuff if you want.


that was usefull... :)
ReplyDelete